GoodBarber's Online Help
Display lines and polygon using a kml file
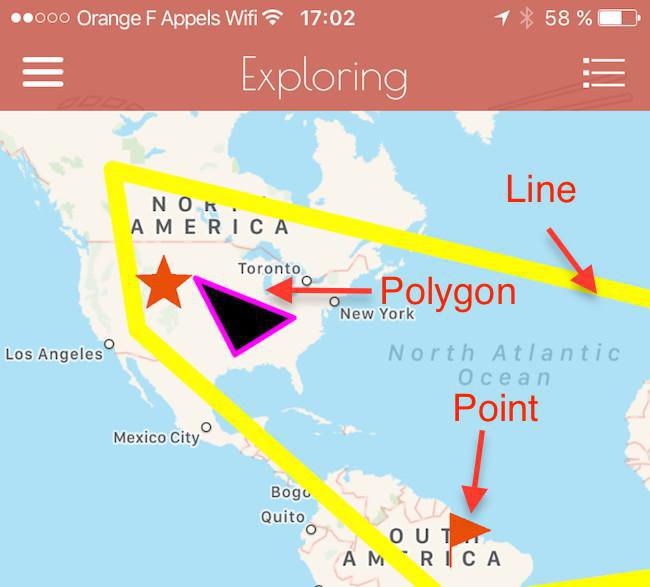
The Map section can display the following geometries :
- Points
- Lines
- Polygons
Lines and Polygons are created by uploading a KML file into the map section.

KML structure
If you don’t have coding skills, we recommend you to use Google Maps to create your kml file. With Google Maps, you can create easily points and lines.
Note that the Map section cannot support the formatting applied to your geometries in Google Maps. For instance, if you choose a color for a line, this color won’t be interpreted by the map section.
If you have coding skills, you can create a kml file where the following properties will be interpreted by the map section:
- Line weight
- Line color
- Polygon outerboundary color
- Polygon outerboundary weight
- Polygon inner color
<?xml version="1.0" encoding="UTF-8"?>
<kml xmlns="http://www.opengis.net/kml/2.2">
<Document>
<Placemark>
<name>Line</name>
<Style>
<LineStyle>
<width>10</width>
<color>ff00ffff</color>
</LineStyle>
</Style>
<LineString>
<tessellate>1</tessellate>
<coordinates>
8.9648438,42.1634034,0.0
-4.3945312,39.6395376,0.0 -117.5976562,57.4212944,0.0
-112.6757812,36.3151251,0.0
-50.9765625,-15.2841851,0.0
24.2578125,-4.5654736,0.0
133.4179688,-22.268764,0.0
101.953125,36.7388841,0.0
39.7265625,58.9953112,0.0
-1.7578125,52.8027614,0.0
9.2175293,42.2366519,0.0
</coordinates>
</LineString>
</Placemark>
<Placemark>
<name>Polygon</name>
<Style>
<LineStyle>
<width>3</width>
<color>ffff00ff</color>
</LineStyle>
<PolyStyle>
<color>ff000000</color>
</PolyStyle>
</Style>
<Polygon>
<tessellate>1</tessellate>
<outerBoundaryIs>
<LinearRing>
<coordinates>
-101.2703028084182,44.03484070243132,0
-93.50548036075496,32.23807715431979,0
-81.86615113861016,38.17061241766041,0
-101.2703028084182,44.03484070243132,0
</coordinates>
</LinearRing>
</outerBoundaryIs>
</Polygon>
</Placemark>
</Document>
</kml>
Importing your line or polygon
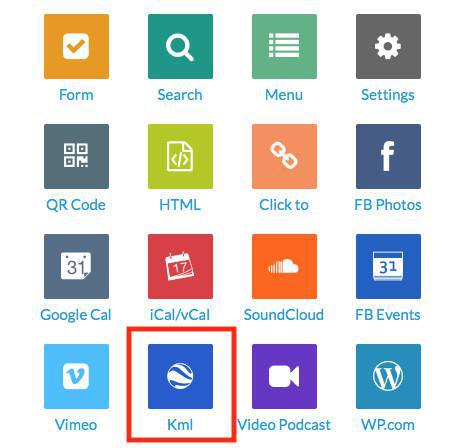
When you add a map section, you have to choose between using the CMS or an external plugin
CMS source
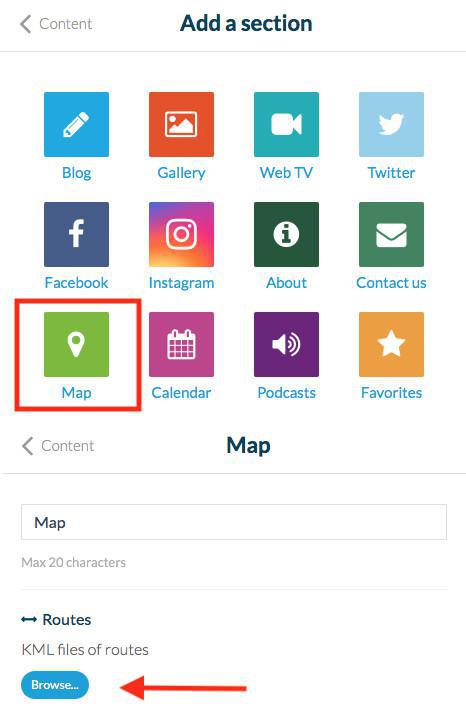
If you choose Map, you can upload a kml file to display lines and polygons.
Go to the Settings tab of the section and upload your file under “Routes”
You benefit from a powerful way to add metadata to your points, thanks to the various options provided by the CMS. You can also display other geometries with the file import.
Note: if you upload a kml file that contains points, lines ,and polygons under the “Route” area of the section. All the geometries will be displayed in the map with the points included.

External source
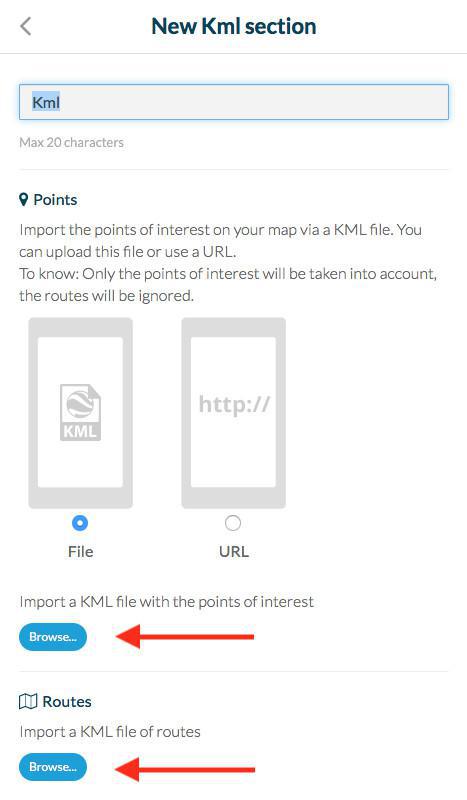
If you choose kml, you will have to upload 2 files to get the map section working properly:
- 1 kml file (or source URL) with the points. Providing the points file is mandatory to have the section working
- 1 kml file with lines and polygons
On the contrary, if you upload a kml file that contains points, lines and polygons under the “Route” area of the section, all the geometries will be displayed in the map.


 Design