Statistics & Dashboard
View your app statistics

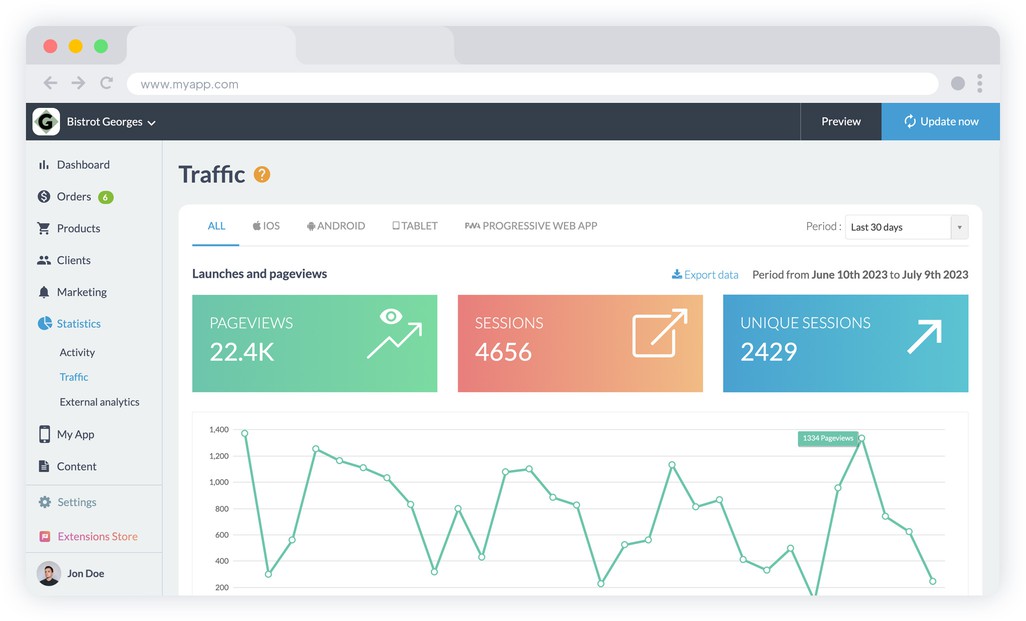
Take advantage of an area designed to display key information on your app's performance. At a glance, analyze the number of launches, unique sessions or page views. Filter your views by period or platform.
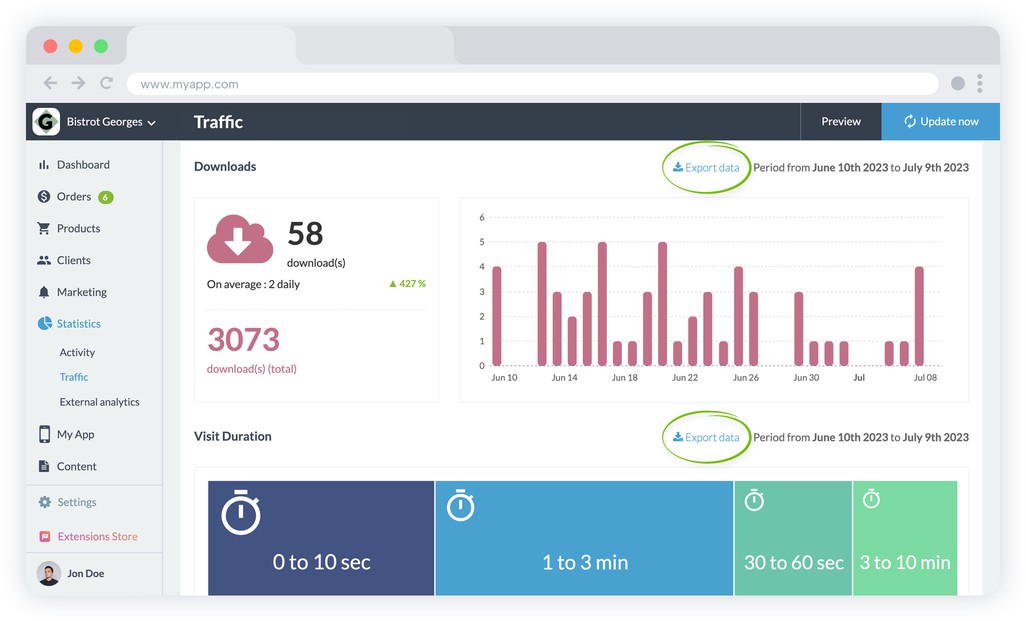
Analyze the number of downloads of your app, per day, per week and since the first day of publication on the stores, the time spent by your users in your app, the operating system versions and terminal models used to consult your app (native only), or the origin of your users: country, city, language.
Analyze your store's performance

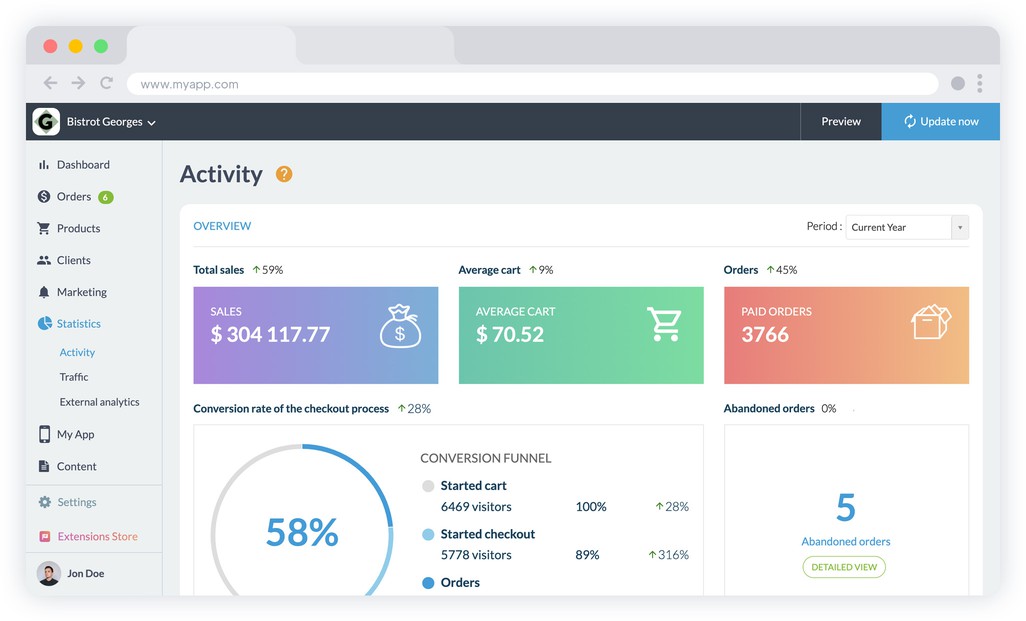
Instantly visualize the revenues generated by your store. You have a direct view of sales on all sales channels. And a comparison with the previous period.
Track the number of sales made over the selected period, and see live progress against the previous period.
Benefit from several key indicators for your store at any time, without any intervention on your part: conversion rate, conversion funnel, add to cart, order process, sales achieved. These indicators are presented in relation to the previous period, so you can see how your store is progressing.
You can also see your store's best-sellers at a glance. You can also monitor stock levels. And any marketing actions to be carried out.
Finally, check out the types of devices your customers use to make their purchases. An invaluable clue for adding a new sales channel tailored to your customers' needs.
Keep your data

There's no time limit on how long you can keep your app's statistics - they'll always be available in your back office.
If you wish, you can export your statistics in .csv format for further analysis in another tool.
 Design


